Breast Cancer Diagnosis
A machine-learning pipeline that classifies tumours as benign or malignant, with a Power BI dashboard for non-technical readers.
- Year
- 2025
- Team
- Team of three
- My role
- Data analysis + dashboard
- Built with
- Python, scikit-learn, pandas, Power BI
/problem
Benign or malignant? And can a doctor who doesn't code read the answer?
The Wisconsin Breast Cancer (Diagnostic) dataset describes tumour cells measured from biopsy images. Our goal was a model that tells benign from malignant reliably, with data cleaning we could defend, and a dashboard that explains the result without any Python.
/pipeline
Six steps from raw data to a dashboard
- 01
Explore
570 patient records with 30 measurements of each cell nucleus: radius, texture, perimeter, area, concavity and more.
- 02
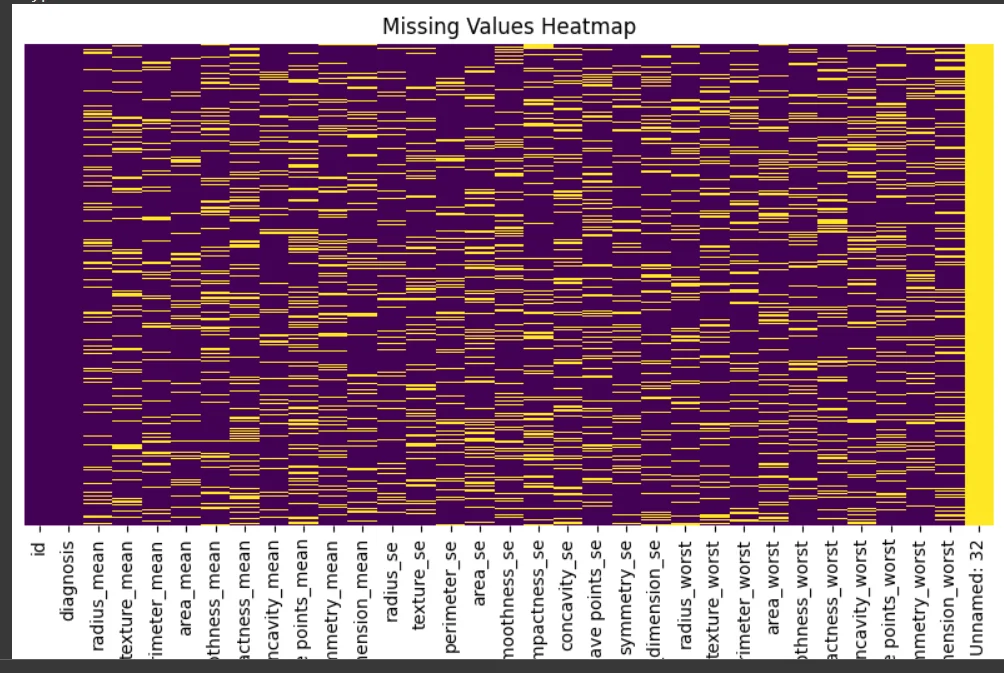
Map what's missing
Heatmaps showed the gaps were missing completely at random, so filling them wouldn't bias the data.
- 03
Fill the gaps
Mean, median and most-frequent imputation were each scored with a Random Forest. Mean imputation won.
- 04
Tame outliers
Found with the IQR rule, then capped rather than dropped, so no patient was thrown away.
- 05
Check the shape
Skewness, kurtosis and Shapiro–Wilk tests showed many features aren't normal, which favours tree-based models.
- 06
Model and explain
Logistic Regression as the baseline, Random Forest as the winner, then a Power BI dashboard for non-technical readers.
Which way of filling gaps works best?
- Mean94.74%
- Median93.86%
- Most frequent92.98%
/results
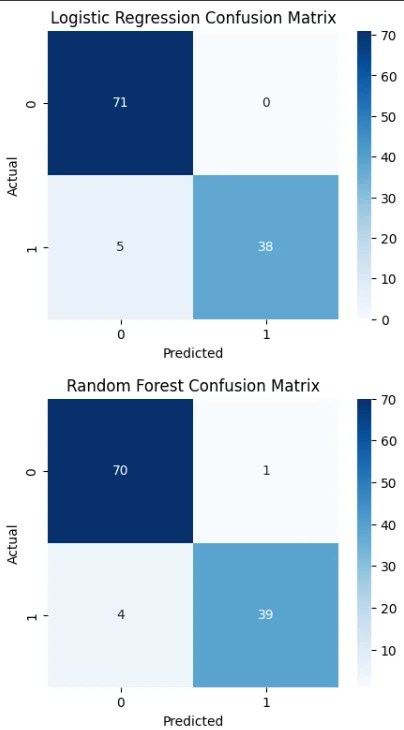
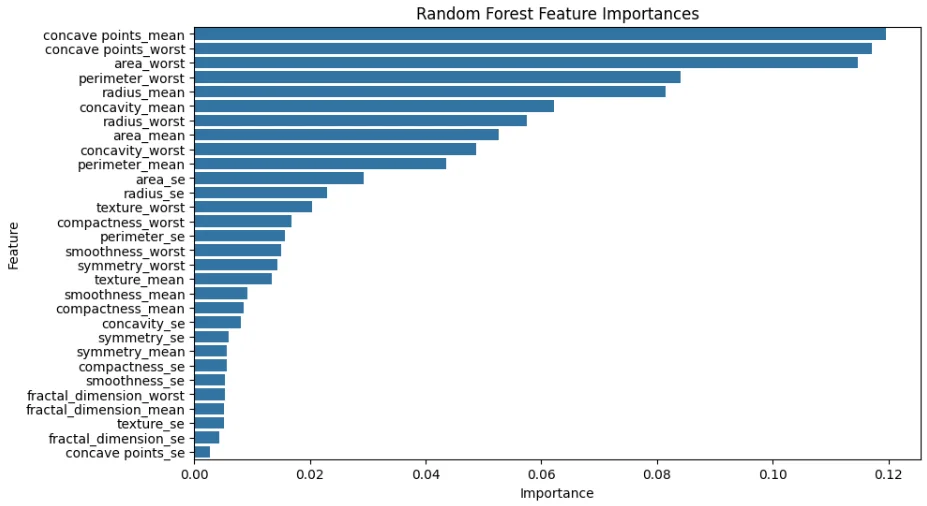
Random Forest wins, and it's better at catching malignant tumours
- Random Forest95.61%
- Logistic Regression94.74%
/dashboard
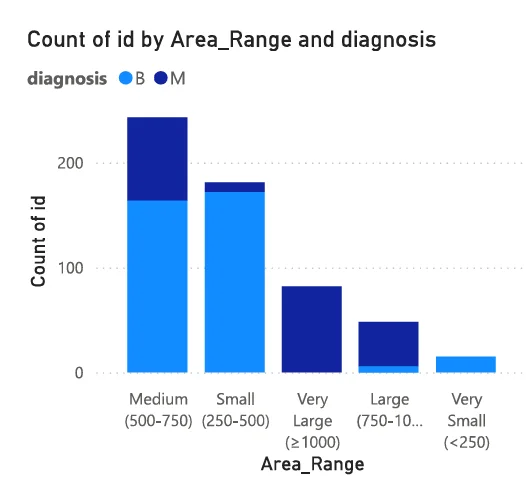
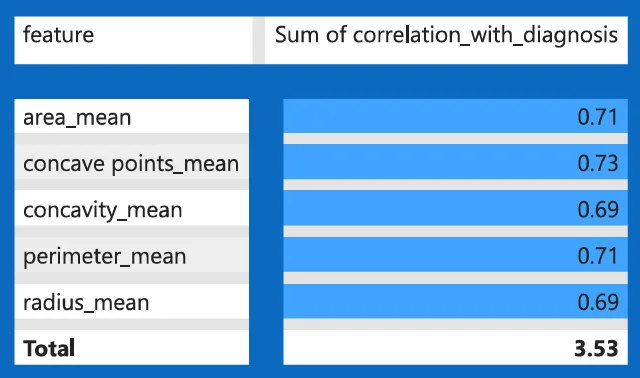
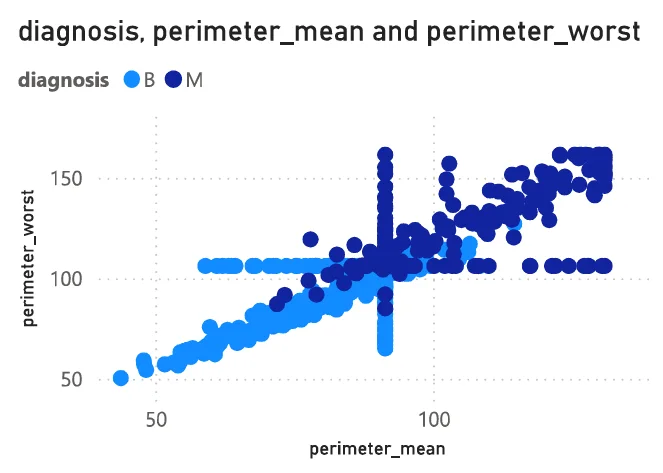
A Power BI dashboard for people who'll never open a notebook